📊 Overall Advertising Performance
Total Spend
$6,980.81
All Platforms Combined
Total Impressions
302,995
Across All Platforms
Google V2 Spend
$69.57
1 Phone Call
Google V3 Spend
$1,736.13
37 Conversions
Meta Ads Spend
$5,175.11
226 FB Leads, 18 Purchases
Google Ads V2: $69.57 (1.0%)
Google Ads V3: $1,736.13 (24.9%)
Meta Ads: $5,175.11 (74.1%)
Note: Results across platforms represent different conversion types (phone calls, form submissions, on-Facebook leads, website purchases) and should not be combined as unique leads.
🔍 Google Ads V2 Performance
Total Spend
$69.57
PMAX | Website Traffic
Impressions
960
Oct 29 - Nov 4
Phone Calls
1
From Ads
Conversions
0
No Reported Conversions
Campaign Breakdown
| Campaign | Status | Budget | Impressions | Phone Calls | Conversions | Spend |
|---|---|---|---|---|---|---|
| PMAX | Website Traffic | Active | $15.00/day | 960 | 1 | 0 | $69.57 |
Paused Campaigns: Search | Phone Calls and Search | Website Traffic remain paused with no activity this period.
Google V2 Daily Performance
📍 Google Ads V3 (Local) Performance
Total Spend
$1,736.13
Local PMAX Campaigns
Impressions
149,852
Oct 29 - Nov 4
Conversions
37
$46.92 Per Conversion
Phone Calls
13
From Ads
Campaign Breakdown
| Campaign | Status | Budget | Impressions | Phone Calls | Conv Rate | Conversions | Cost/Conv | Spend |
|---|---|---|---|---|---|---|---|---|
| Local PMAX General | Active | $240/day | 129,344 | 1 | 0.32% | 26 | $54.70 | $1,422.23 |
| Local PMAX Expanded Locations | Active | $60/day | 20,500 | 12 | 3.16% | 11 | $28.47 | $313.16 |
| Total | 149,844 | 13 | 37 | $46.92 | $1,735.39 | |||
Campaign-level spend totals $1,735.39 while account-level reports $1,736.13. The account-level total is used in the summary.
Conversion Breakdown
24
Get Directions
7
Contact
6
Phone Call Lead
0
Pageview
0
Engagement
Google V3 Daily Performance
⚖️ Google V2 vs V3 Comparison
Google Ads V2
Spend
$69.57
Impressions
960
Conversions
0
Phone Calls
1
Google Ads V3 (Local)
Spend
$1,736.13
Impressions
149,852
Conversions
37
Phone Calls
13
📘 Meta Ads Performance
Total Spend
$5,175.11
3 Active Campaigns
Impressions
152,183
Oct 29 - Nov 4
Facebook Leads
226
On-Facebook Leads
Website Purchases
18
From Ads
CTR (All)
1.65%
Click Through Rate
Cost Per Lead
$22.90
Approx. Per FB Lead
Campaign Breakdown
| Campaign | Status | Impressions | Purchases | Cost/Purchase | FB Leads | Cost/Lead | Spend |
|---|---|---|---|---|---|---|---|
| Lead Campaign | Sales vs Informative | Top 14 States [DS4C] | Active | 53,147 | 8 | $214.13 | 67 | $25.57 | $1,713.05 |
| Lead Campaign | Sales vs Informative | Top 14 States | Active | 48,849 | 7 | $239.45 | 54 | $31.04 | $1,676.13 |
| Lead Campaign | [DS4C] | Active | 50,187 | 3 | $595.31 | 105 | $17.01 | $1,785.93 |
| Total | 152,183 | 18 | $287.51 | 226 | $22.90 | $5,175.11 | |
Meta Ads Daily Performance
Cost Efficiency by Campaign
🎨 Top Campaign Creatives
| Creative | Link Clicks | CTR (All) | Purchases | FB Leads | Spend |
|---|---|---|---|---|---|
| Creative 1 | 27 | 3.66% | 0 | 8 | $117.95 |
| Creative 2 | 17 | 2.30% | 0 | 3 | $81.45 |
| Creative 3 | 13 | 3.18% | 0 | 2 | $56.87 |
Showing top 3 of 7 creatives by performance. Creative names are not available in the exported data. All top 3 creatives drove Facebook leads with zero direct website purchases.
📈 Daily Performance Trends
Daily Spend Across All Platforms
Daily Conversions / Leads
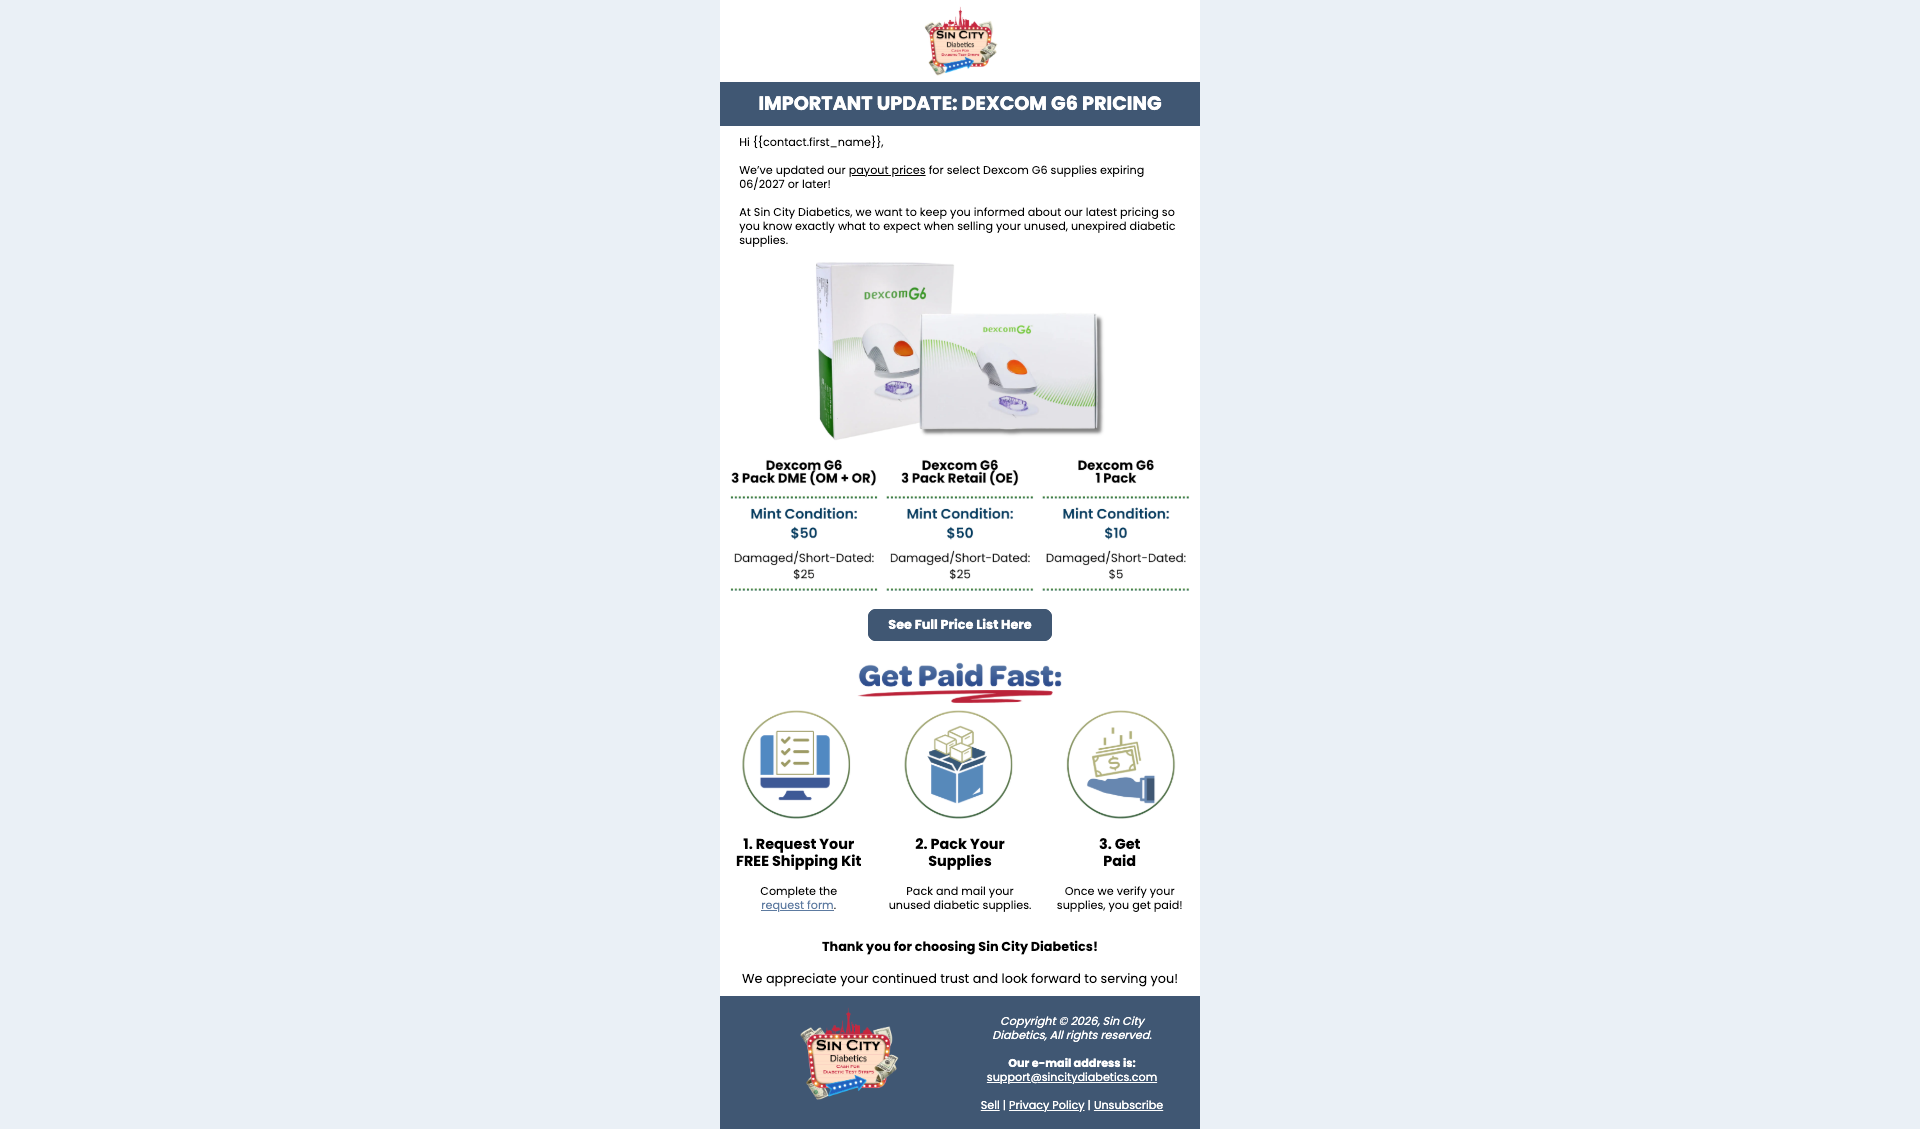
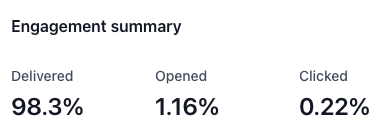
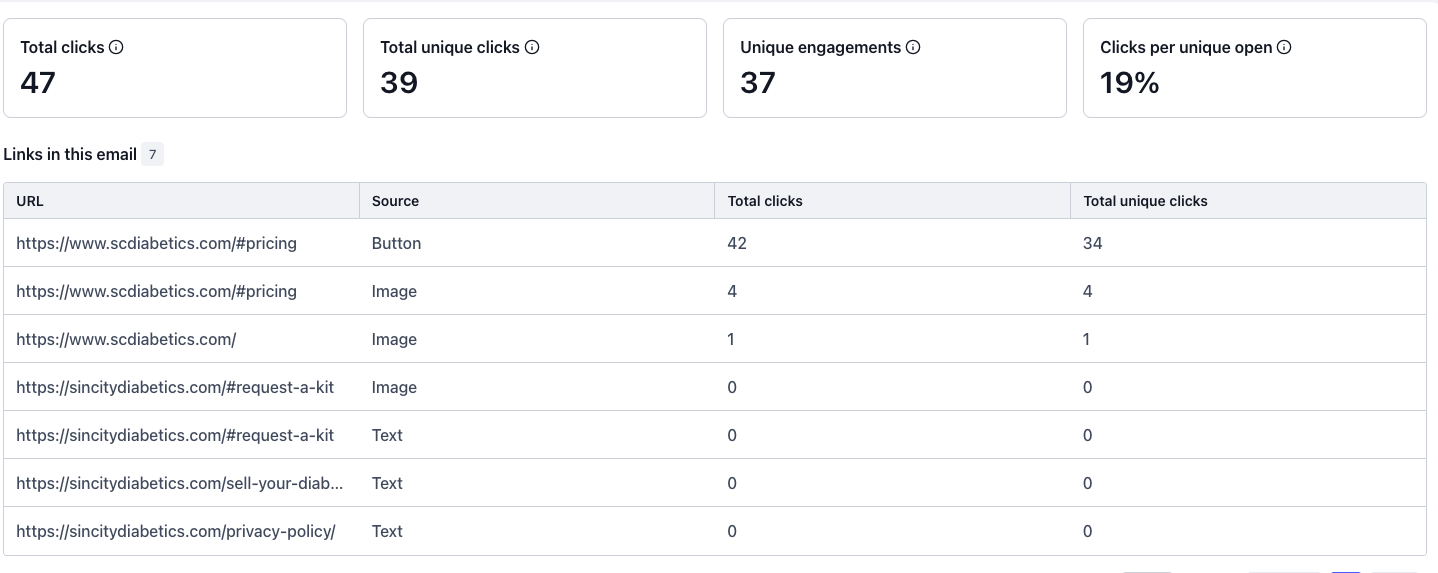
📧 Dexcom G6 Price Change Oct Email - Resend
Email Stats
Click Performance
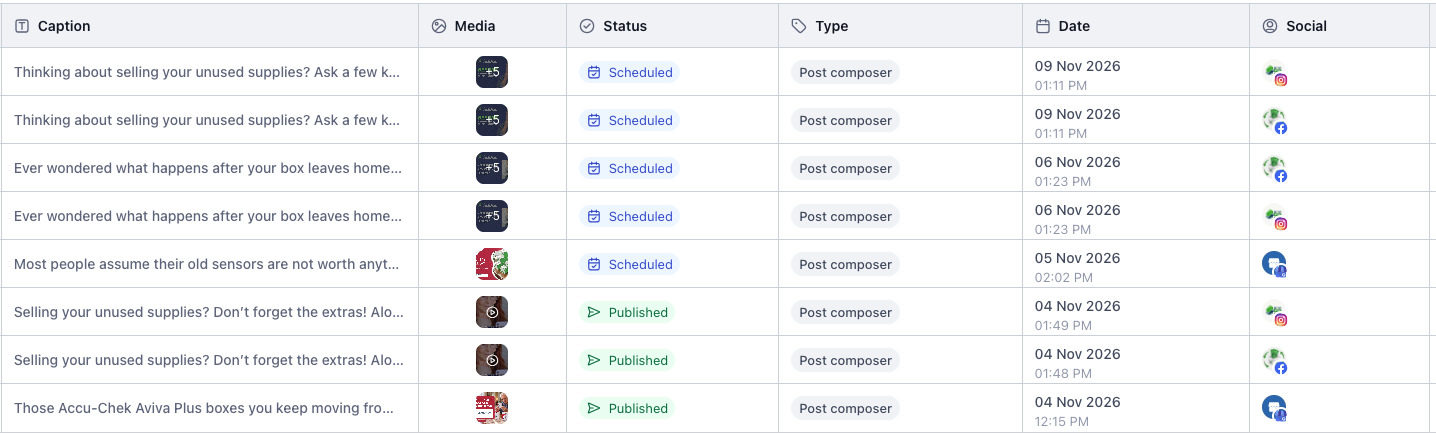
📱 Social Media Planner
📋 Coming Up Next Week
- Continue monitoring Google V3 Local PMAX campaigns for conversion volume
- Evaluate Meta Ads lead quality across all three active campaigns
- Review Expanded Locations campaign performance (strong $28.47 CPA)
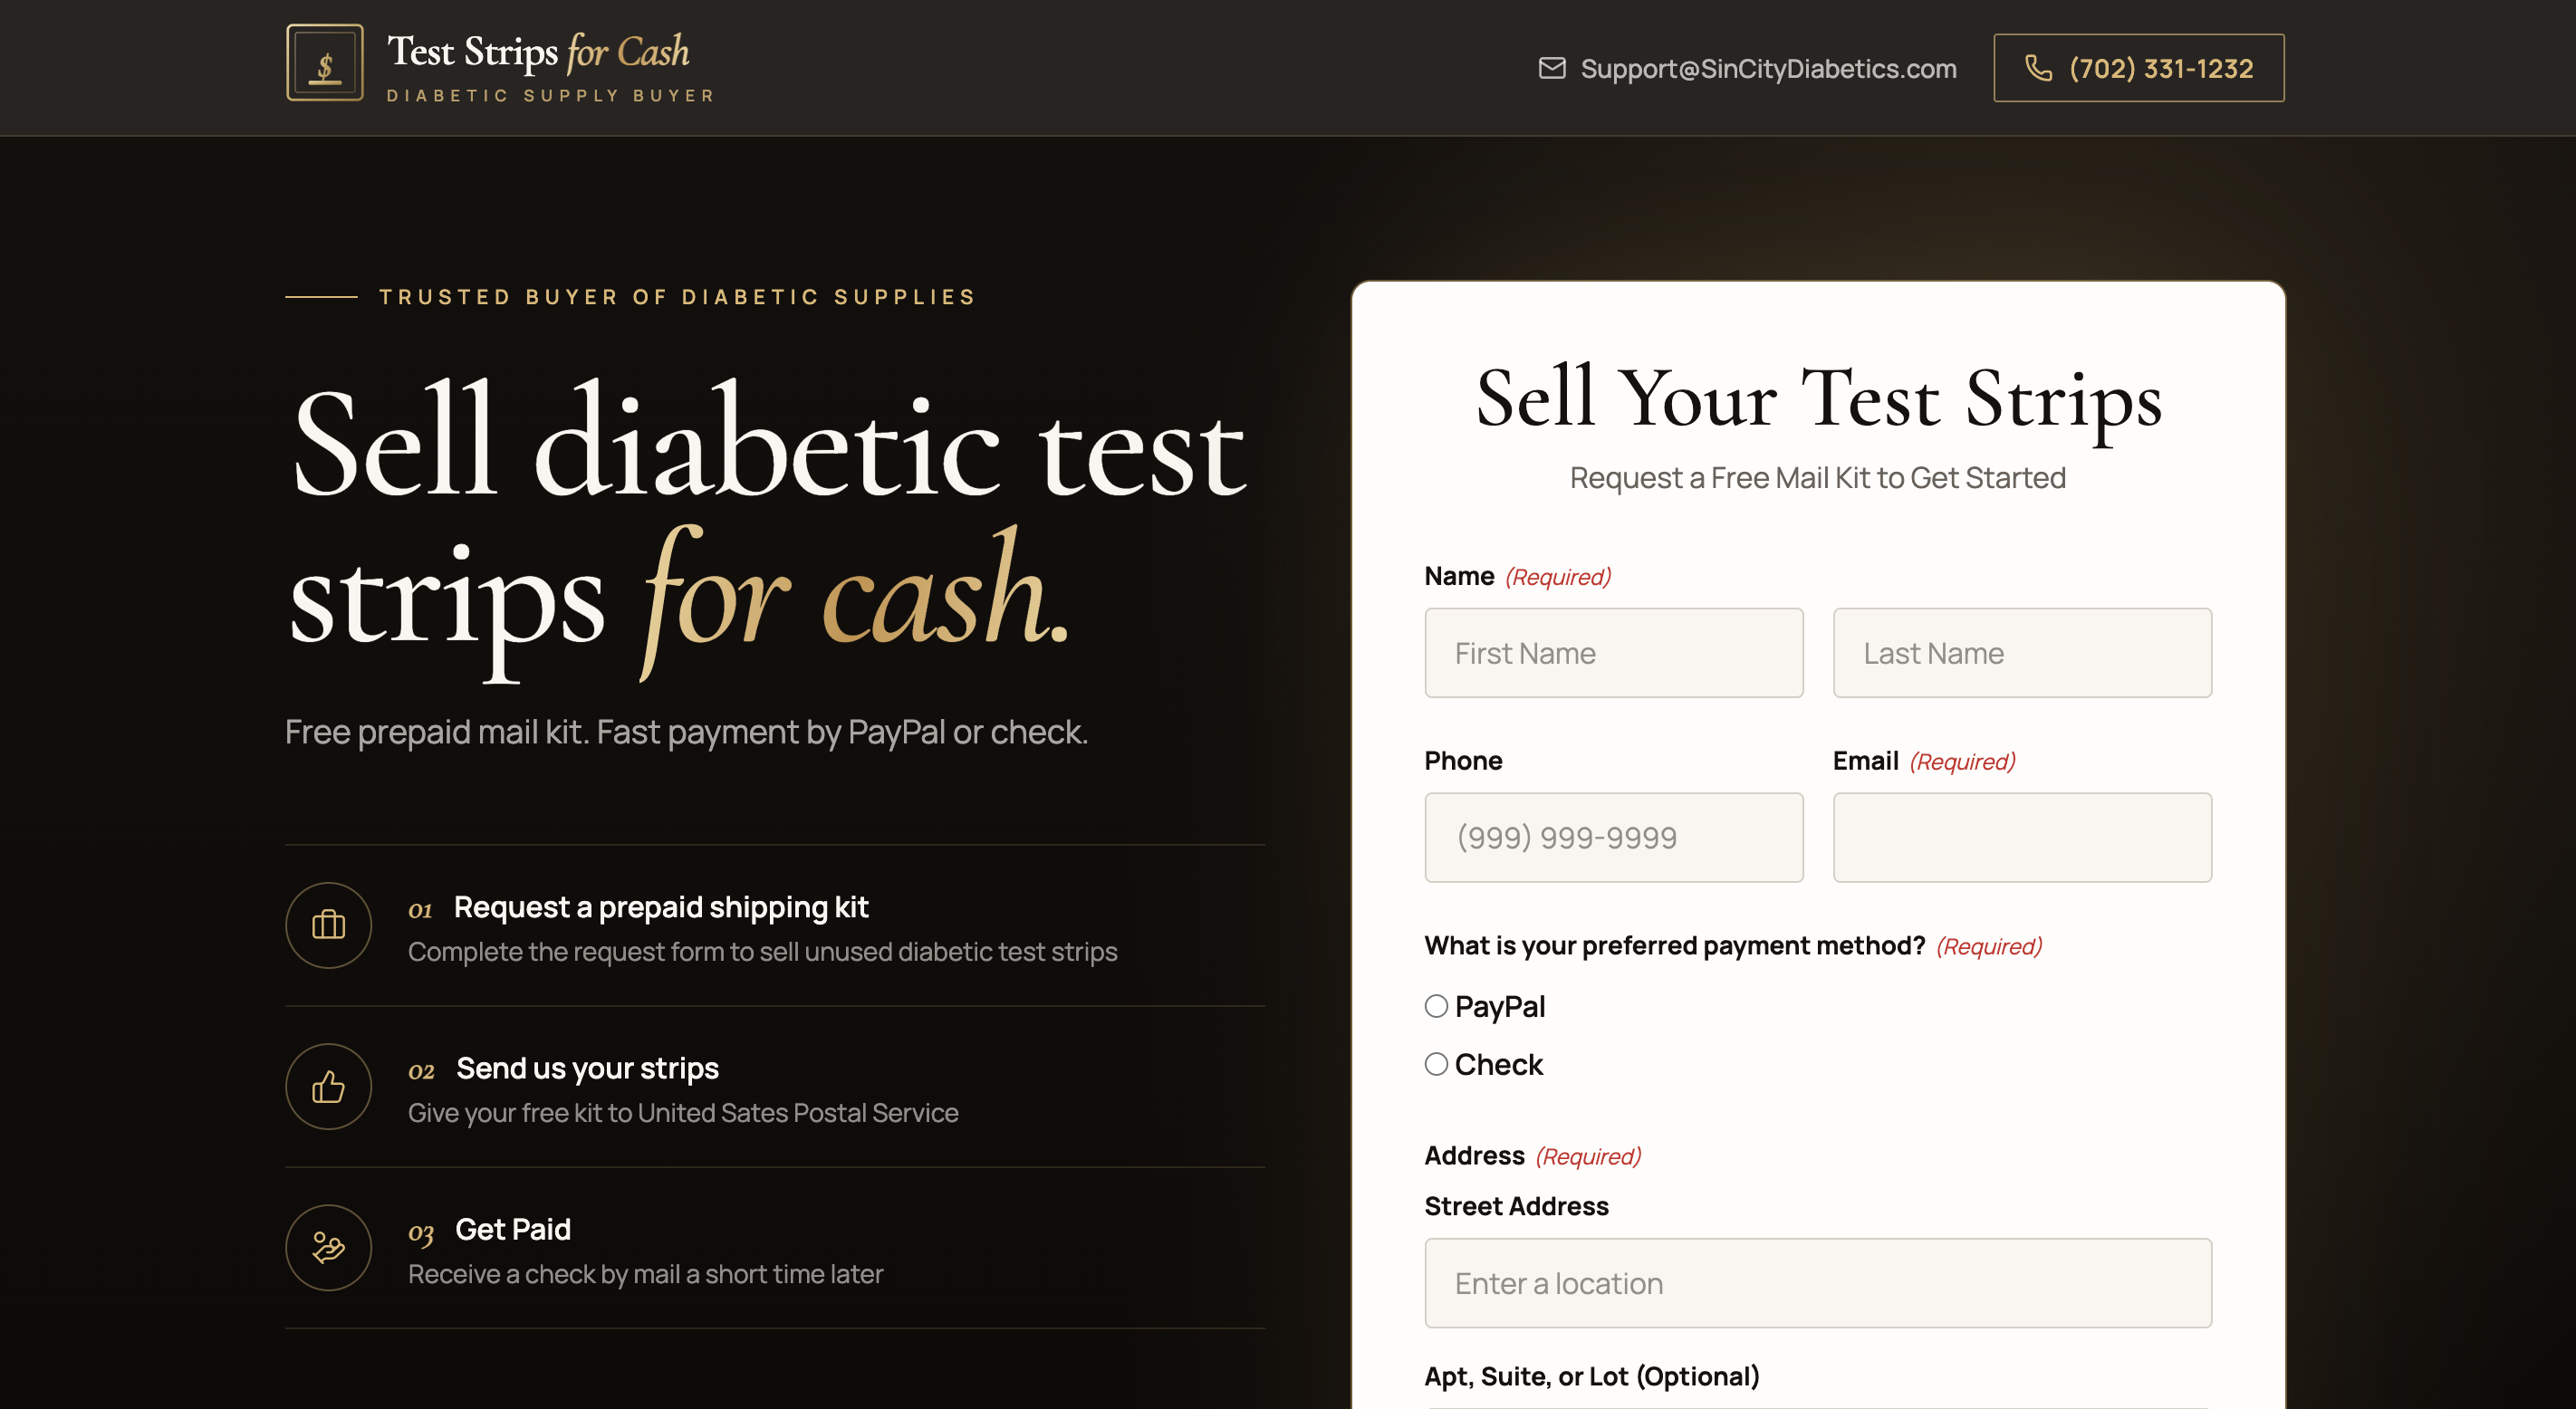
- Monitor new Test Strips for Cash website traffic and engagement
- Track Dexcom G6 price change email follow-up responses